Dossier Océan et énergie - Énergie Thermique des Mers
Sommaire IOA News Letters
Research on Artificial Upwelling and Mixing at the University of Hawaii at Manoa
Dr.Clark
C.K. Liu, Professor of Civil Engineering
University of Hawaii at Manoa,
Honolulu, HI 96822
liu@wiliki.eng.hawaii.edu
ABSTRACT
The development of commercially viable open ocean mariculture using nutrient-rich deep ocean water (DOW) encounters the following problems: (1) bringing nutrient-rich DOW up to ocean surface cost-effectively, (2) controlling DOW effluent plume within the biologically-productive zone of upper ocean, and (3) identifying suitable marine species to culture. Over the last few years, researchers at the University of Hawaii at Manoa have tried to resolve the first two problems by conducting research on artificial upwelling and mixing (AUMIX). A wave-driven artificial upwelling device was developed based on mathematical modeling, hydraulic laboratory experiments, and ocean testing. The prototype device consists of a buoy with a water chamber of 4.0 m in diameter, a tail 300 m in length and 1.2 m in diameter, and a flow-controlling valve. This device can produce an upwelling flow of 0.45 m3/sec in regular Hawaiian waves of a period of 12 sec and a wave height of 1.9 m. Hydraulic modeling experiments were conducted to investigate the formation of nutrient-rich DOW plumes in the open ocean. It was found that, by proper effluent control, desirable nutrient-rich DOW plumes can be established and maintained within the biologically-productive zone in the open ocean.
INTRODUCTION
Many of the world ¡¦s fishery resources are presently overexploited and in a state of decline. This is happening in a period when the world population has passed the 6 billion mark and continues to increase. Increase in fishery yields will require better management at both national and international levels. Also necessary will be the development of new technologies such as stock enhancement to restore many of these resources. A technology that could enhance fishery resources is bringing deep ocean water (DOW) to the surface through artificial upwelling to enhance food webs. With the exposure of these relatively high nutrient waters to sunlight and surface residing communities, local increase in production may be possible.
Land-based aquculture using deep ocean water pumped from the ocean depths into man-made ponds and enclosures has been in existence for more than a decade. It has been conducted at the Natural Energy Laboratory of Hawaii (Daniel, 1984) and at the Kochi Artificial Upwelling Laboratory in Japan (Nakashima et al., 1989). These land-based aquaculture enterprises have used DOW for growing algae (kelp, Gracilaria and Spirulina) at the base of the foodweb as well as in the aquaculture of primary herbivores (e.g. abalone) for commercially successfully ventures.
However, land-based aquaculture is small in scale; providing adequate food supply for the worlds increasing population requires a large-scale development of open ocean mariculture. Increasing fish production by using DOW can occur through either increased primary productivity or a shortening of the foodweb. A very important aspect to this enhancement is undertaking the effort at a sufficiently large scale to allow meaningful surface enhancement to occur. Theoretically, the larger the scale of enhancement, the longer and more complex the enhanced food web will become. Preliminary experiments in Japan have demonstrated the viability of combining artificial reef and fish aggregation devices with deflectors that alter current flow and cause upwelling which attracts fishes and enhances local productivity in shallow water (Grove et al., 1989).
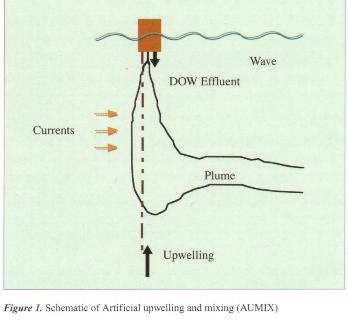
One of the major obstacles to large-scale development of open ocean mariculture has been the energy cost associated with artificial upwelling. Another major obstacle to commercial open ocean mariculture has been the difficulty of containing DOW effluent plume within the biologically productive area of the open ocean without significant dilution (Liu, Sun 1990). Researchers at the University of Hawaii at Manoa have been engaged in the study of artificial upwelling and mixing (AUMIX that can be translated to Chinese phonically as mysteries) to overcome these obstacles (Figure 1).
AUMIX research haven been successfully conducted in two phases with funding support from the US National Science Foundation. The objective of the first phase AUMIX research, conducted from 1992 to 1996, was to develop a wave pump which brings DOW cost-effectively to the surface (Chen, Liu and Guo 1994; Liu and Jin 1995; Liu et al., 1999). The objective of the second phase AUMIX research, which was started in 1997, was to establish a nutrient-rich DOW effluent plume that can support open ocean mariculture.
This paper summarizes the results and findings derived from Phase I and II of the AUMIX study. Mathematical modeling analysis in relation to the formation of a nutrient-rich plume, a part of the Phase II study, is still underway and will be reported on later.
WAVE-DRIVEN ARTIFICIAL UPWELLING
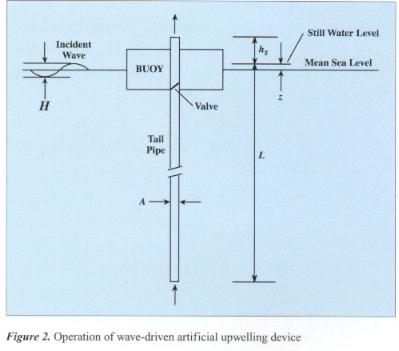
Wave-driven artificial upwelling, which convert the wave power to kinetic energy of upwelled deep ocean water can be achieved by a device as shown in Figure 2. As the wave crest approaches, the flow-controlling valve of the device is closed and the water column inside the device rises together with the device. As the wave descends, however, the valve is open and the water column inside the device continues its upward movement due to inertial. Therefore, when a device moves up and down in the ambient waves, the water column inside the device keeps moving upward and brings the deep ocean water to the surface.
The performance of the device, which depends on how efficiently the wave power is converted into the kinetic energy of the water column inside the device, can be evaluated by a set of mathematical equations which describe the simultaneous movement of the water column inside the device as well as the device itself.
When the valve is closed, the velocity of the water column relative to the device is zero or,
![]() (1)
(1)
Under this condition, the equation of motion of the device takes the following form:
![]() (2)
(2)
where mw is the mass of the water in the pipe; z is the displacement of the heave of the buoy above still water line; m is the mass of the floating system; Fe is the wave exciting force in the vertical direction.
When the valve is open, the relative acceleration of the water column to the device can be determined by:
![]() (3)
(3)
In deriving Eq (3) the dynamic pressure produced by the surface waves is ignored.
The equation of motion of the device when the valve is open takes the form of:
¡@![]() (4)
(4)
Eq (2) and Eq (4) are similar except that in Eq (4) only the mass of the floating system is considered, and in Eq (4) the viscous effect due to relative movement of the water inside the pipe is included.
The added mass ma, damping coefficient b, and exciting force Fe are important parameters describing the wave and device interaction. The exciting force indicates the magnitude of external force acting on the device and is a function of incident waves. The added mass and damping coefficient indicate the extent of resistance and are functions of device design, i.e. the dimensions of the device, tail pipe length, etc.
According to the three dimensional linear wave theory, values of added mass, damping coefficient and exciting force can be determined by integration of velocity potentials over wetted surfaces (Faltinsen and Michelsen, 1974).
The set of modeling equations, along with known added mass, damping coefficient, and exciting force constitute a general mathematical model of wave-driven artificial upwelling. A computer program was prepared to solve modeling equations numerically using a Runge-Kutta method (Liu and Jin, 1995).
Various device designs were considered and evaluated by mathematical modeling and by a series of hydraulic experiments which were conducted in a wave basin at the Oceanographic Engineering Laboratory of the University of Hawaii testing (Chen, Liu and Guo, 1995). The final design of the device selected consists of two principle parts; (1) a buoy with a water tank of 4.0 m in diameter, and (2) a long tail pipe of 300 m in length and 1.2 m in diameter with flow controlling valves.
In a few past studies, only wave-driven artificial upwelling in regular waves was investigated (Issacs et al. 1976; Vershinskiy et al. 1987). In order to evaluate the performance of a wave-driven artificial upwelling device in actual field conditions in this study, a time series representing Hawaiian random waves was developed first and later used in modeling analysis. Random ocean waves off the Hawaiian Islands were synthesized from a wave spectrum obtained in this study, based on available data and the general form of the Bretschneider spectrum (Bretschneider, 1969). Results of mathematical modeling of the motion of the device and water column in random waves are indicated in Fig.5. In this modeling analysis, the artificial upwelling device has a buoy of 4.0 m in diameter and a tail pipe of 300 m in length and 1.2 m in diameter. The height and period of the regular waves, 1.90 m and 12.10 s respectively, are the same as the significant wave height and period of random Hawaiian waves. Modeling results indicate that this device can generate an upwelling flow of 0.95 m3/s in Hawaiian random waves and an upwelling flow of 0.45 m3/s in regular waves (Liu and Jin 1995).
A simple predictive equation for a quick estimation of the rate of upwelling flow was formulated based on dynamic consideration of the relative movement of the water column to the device. This simple equation takes the following form:
![]() (5)
(5)
where Q is the rate of upwelling flow; A is the cross section area of the tail pipe; H and T are the wave height and period; £\ and £]are empirical constants.
Both £\ and £]denote the hydrodynamic performance of the upwelling system. The coefficient £\represents the ratio of the oscillation displacement of the device to the wave amplitude. When the wave period is large and the device nearly follows the wave motion, £\ would approach a value of 1. The coefficient £] depends on the hydrostatic pressure acting on the bottom of the water column. If the hydrostatic pressure is zero, 2 would also approach 1. Under these conditions, Eq (5) becomes
![]() (6)
(6)
In past studies, only wave-driven artificial upwelling in regular waves was investigated (Issacs et al. 1976; Vershinskiy et al. 1987). Therefore, it requires that the value of ± remains unity. The value of 2 depends on the height of the outlet above the still water level, hs (Figure 2). The maximum upwelling flow rate occurs when hs = 0 and there is no hydraulic pressure acting on the bottom of the water column. For ocean wave periods of 8-12 s, the movement of the device deviates significantly, and the Issacs and Vershinskiy formula or Eq. (6) is not valid. A linear analysis was later conducted to evaluate conditions under which the device does not follow the movement of the ambient waves (Liu et al., 1999).
INITIAL MIXING OF A NEGATIVELY-BUOYANT TURBULENT JET
Phase II AUMIX research investigated the discharge of artificially upwelled DOW and its subsequent mixing in the open ocean. The objective was to establish a nutrient-rich plume that can support open ocean mariculture (Fig.1). To achieve this objective, the mixing must be controlled such that the dilution is small and the settling depth does not go below the euphotic zone of the upper ocean.
The DOW effluent enters the ambient ocean water as a negatively buoyant jet. The nature of its initial or near-field mixing is determined by two sets of parameters. One set includes the discharge parameters of discharge velocity, density of the effluent, and position and orientation of the diffuser ports. The other set encompasses the environmental parameters including currents, density of the ambient water, and waves. Generally, proper engineering design or effluent control can control the discharge parameters. A careful analysis of near-field mixing processes of the surface discharge of a negatively buoyant jet was conducted. Special attention was given to wave effects on the near-field mixing processes, a subject that has not been thoroughly dealt with in previous studies.
The mixing characteristics of a round turbulent buoyant jet in a stagnant ambient water can be described by its discharge momentum flux, M; buoyancy flux, B; and volume flux, Q (Fischer, et al. 1979). Predictive equations were formulated in terms of two dimensionless parameters of z/lQ and z/lM where z is the distance along the jet centerline; lQ and lM are characteristic length scales, lQ = Q/M1/2 and lM = M3/4/B1/2.
Only a few past studies of wave effects on turbulent jet mixing were reported. Ismail and Wiegel (1983) indicated that momentum jets expand at a greater rate in the presence of waves due to the interaction of waves with jet driven flow. Ger (1979), Chin (1987), and Hwang et al. (1996) conducted physical and mathematical modeling analysis and showed that surface waves have significant effects on the mixing process of a buoyant jet.
The maximum horizontal wave-induced velocity at the discharge point, umax was used by most past studies to evaluate wave effects on jet mixing. Eq (7) was formulated by Chin (1987) to predicted the surface dilution of a buoyant jet under wave actions,
![]() (7)
(7)
Where S and So are the surface dilution with and
without wave effects; ![]() is another
characteristic length scale.
is another
characteristic length scale.
Eq (7) was formulated on the basis of specific discharge and ambient
conditions of ![]() , where H is the depth of the
discharge port. More recently, jet mixing with surface waves was evaluated by
Swan and Kwan (1999) using a dimensionless variable
, where H is the depth of the
discharge port. More recently, jet mixing with surface waves was evaluated by
Swan and Kwan (1999) using a dimensionless variable![]() where U0 is the jet discharge velocity.
where U0 is the jet discharge velocity.
Eq (7) predicts only the initial dilution as a buoyant jet reaches the water surface. It is applicable to discharge and ambient conditions as specified above.
Liu and Lin (1998) investigated wave effects on the mixing of a negatively buoyant jet discharged at the ocean surface or the upper ocean by hydraulic modeling experiments.
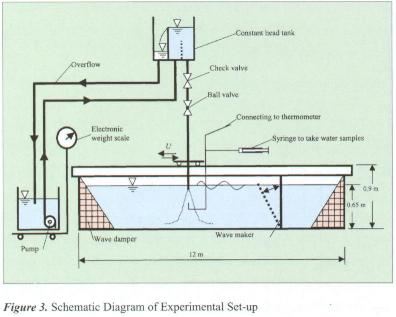
Experiments were conducted in a 12 m ´ 1.2 m ´ 0.9-m glass wave tank (Figure 3). The diameter of the injection nozzle orifice is 0.45 mm. The experiments were conducted with jet discharges larger than 14 cm3/sec to assure that the jet is turbulent. Liu and Lin (1998) contains the details about the experimental set-up.
Results of hydraulic experiments in this study indicated that, wave characteristic ro as well as umax must be used in evaluating the effect of waves on jet mixing. The variable ro is the maximum wave-induced water particle displacement at the discharge port. An empirical equation was derived by (Liu and Lin, 1998) to estimate wave influence on the dilution along a jet centerline,
where S0 is the dilution of a buoyant jet along its centerline without wave actions and S is the dilution with wave actions; z is the vertical downward distance measured from the still water level; z0 is the location of discharge point below the still water level.
Eq (8) is rather general. It can be used to predict the dilution of a turbulent buoyant jet without wave actions, or ro = 0. It also can be used near the injection point (z = 0) where the action of wave velocity is overshadowed by the initial jet velocity.
The research scope was later extended to investigate jet mixing under the influence of both surface waves and currents (Liu, 1999). Figure 4 shows the results of a typical experimental run that was conducted under the following discharge and ambient conditions: ratio of current velocity (U) and jet discharge velocity (U0) R=0.11; jet densimetric Froude number Fd=8.3; z/lQ=20; z/lB=2.23 where lB = B/U3 is the buoyancy length scale (Wright, 1977).
Two regions of measured dilution of a turbulent buoyant jet under the influence of crossflow and surface waves actions are noted. The effect of wave effect in the first region of relatively weak surface waves (ro / lQ <1.0) is negligible. Within this region, the wave effects can be ignored and the dilution can be predicted satisfactorily by the relations established by Wright (1977) for jets in a crossflow.
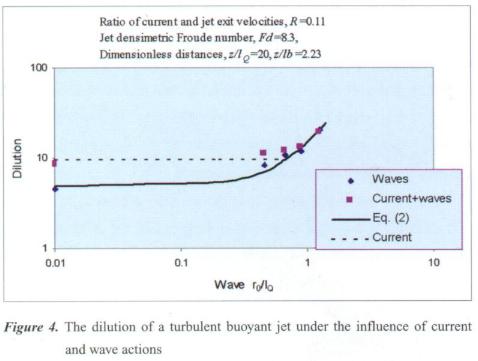
On the other hand, the effect of wave in the second region (ro / lQ >1.0) is dominant. Within this region, the influence of currents can be ignored and Eq (8) can satisfactorily predict the dilution.
Waves generated in this study were intermediate water waves. In deep water waves, the wave-induced particle movement declines exponentially with water depth and Eq (2) can be modified as,
 (9)
(9)
where k is wave number.
Mathematical modeling analysis is being conducted at this time to further investigate the effect on DOW mixing by deep water waves.
FIELD TESTING
A wave-driven artificial upwelling device was designed and constructed in the Hydraulic Modeling Laboratory of the Department of Civil Engineering, University of Hawaii at Manoa (Figure 1). It is a 1/10 model of the full size device. The buoy, made of a syntactic foam, is a 40-inch diameter vertical cylinder with a height of 20 inches. The center of the buoy is hollow with a 20-inch diameter cylindrical water chamber. The top and bottom of the buoy are reinforced with sheets of 0.75-inch thick marine plywood. The cylindrical water chamber extends from the lower plywood sheet to the upper plywood sheet. The center of the upper sheet has a 16-inch diameter hole for ventilation. A 2-inch outflow pipe, made of plastic, is 10 inches above the lower sheet. The entire buoy is held together with eight 5/16 inch threaded rods, which extend from the bottom sheet to above the top sheet. The entire buoy, excluding the tail pipe, weights about 90 pounds when wet.
A 4-inch diameter PVC tail pipe protrudes from the bottom of the buoy. The pipe is connected by a bolted flange to the lower plywood sheet. The flow-controlling valve is a rising stem type and is constructed of lightweight materials to allow the valve to open and shut with a minimum of force. The end of the stem is threaded to allow weight to be easily added or subtracted from the valve stem so that the performance of the valve can be adjusted during field operation. The tail pipe is made of 20-foot sections, which are connected together by threaded couples. Each pipe section weights about 90 pounds. The bottom 3 feet of the last tail pipe section is made of steel to provide stabilization weight.
Two ocean field experiments were conducted on July 20, 1996 and on August 16, 1998, about 1 mile off the southern coast of Oahu, Hawaii.
In the July 1996 experiment, the device with an 80-ft tailpipe was lunched from a 43-foot vessel. The vessel has a flush deck with no cabin top, which was ideal for this experiment (Figure 5).
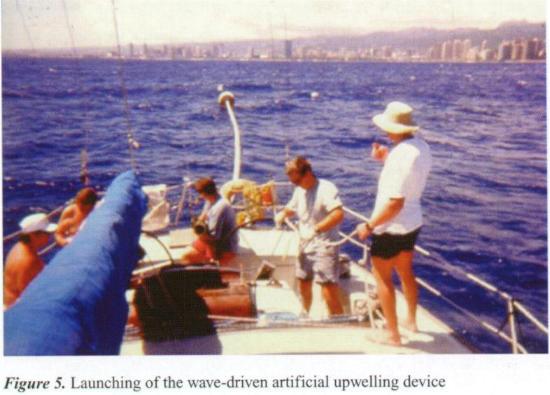
During the experiment, ocean waves were 3 feet high and choppy, the period was about 4 seconds. A fluorescent dye was released to measure the rate of upwelling flow produced by this device. This was accomplished by a scuba diver that descended to the lower end of the tail pipe and released a dye packet (Figure 6). The rate of upwelling flow can be estimated in terms of the time required for the dye to travel through the entire length of the tail pipe. The experimental data showed that the dye traveled through an 80 feet section of the tail pipe in 50 seconds, or an average upward flow velocity of 1.6 feet per second. This corresponds to an upwelling flow of about 0.14 cfs (cubic feet per second), which is very close to the calculated value.
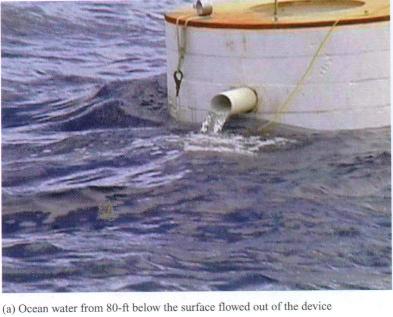
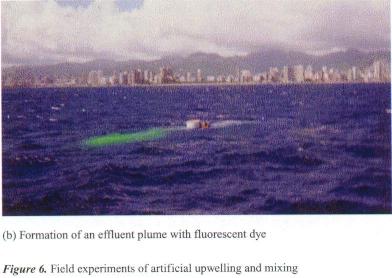
It is noted that 1:10 model scale was used in this experiment. The lower end of the device from where the ocean water was pumped up was only 80 feet below the surface. Therefore, the effluent plume was not subject to negative buoyancy.
In the August 1998 experiment, more detailed measurements of upwelling flow rate and the mixing characteristics were conducted. Also, two tailpipe lengths of 40 feet and 100 feet were used. The rates of upwelling flow were measured directly using a bag attached to the outlet. Results are shown in Table 1 below:
Table 1. Measured bag filling time
| ¡@
Scenario |
Average | |||
| First | Second | |||
| 40 | 45 | 55 | 51 | 50 |
| 100 ¡¦ tail pipe | 49 | 42 | 45 | 45 |
The volume of the plastic bag was 3.6 ft3 (determined in a weighting tank in the Hydraulic Laboratory of the UH Civil Engineering Department). Therefore, the average flow rate is 0.07 cfs for a tail pipe length of 40 feet and 0.08 cfs for a 100-feet tail pipe. These values again are very close to the values calculated by Eq (7). These results also indicated that the upwelling flow rate depends on the length of the tailpipe; the longer the tailpipe more deep ocean water can be brought to the surface.
Based on experimental results, it is possible to estimate the upwelling rate that can be generated by a prototype device. Because the model scale is 1:10, there following relations exist:
Lm/Lp= 1/10, Tm/Tp= 1/
![]() ,
Vm/Vp= 1/
,
Vm/Vp= 1/
![]() , Qm/Qp= 1/
, Qm/Qp= 1/
![]() ,
,
Where subscript m stands for model; and subscript p stands for the prototype, L is length; T is time; V is velocity; and Q is discharge rate.
For the
prototype, the upwelling flow rate would be about 0.07![]() = 22.14 cfs, or 0.63 m3/sec. This is
very close to the results derived by a detailed mathematical modeling analysis
by Liu and Jin (1995).
= 22.14 cfs, or 0.63 m3/sec. This is
very close to the results derived by a detailed mathematical modeling analysis
by Liu and Jin (1995).
The mixing experiment was carried out in a device as shown in Figure 7. Dye was injected into the outlet pipe where it is attached to the buoy. It is considered completed mixed before flowing out of the pipe. The samples were taken by a diver at the outlet of injecting pipe and a point with distance of 20 lQ. Then the samples were measured by a fluorometer at the laboratory. The measurement results are shown in Table 2.
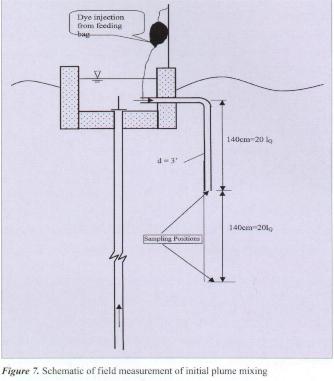
Table 2. Measured Dye Concentration
| Sampling Position | Concentration Measured | Average | ||
| First | Second | Third | ||
| Outlet | 1190 | 1270 | 1280 | 1247 |
| 20 lQ | 203 | 206 | 207 | 205 |
The measured dilution at a distance of 20 lQ was 1247/205 or 6.05. This value was much smaller than the calculated dilution of 10.4 by using Eq (8). This discrepancy is probably due to the fact that Eq (8) was derived under laboratory conditions for shallow to intermediate water waves, but the ambient ocean waves are deep water waves. Mathematical modeling analysis is being conducted at this time to further investigate the effect on DOW mixing by deep water waves.
DOW EFFLUENT PLUME DESCENGING AND DILUTION
The equation derived above was used to investigate the mixing of DOW effluent brought up by an artificial upwelling device. The following environmental conditions used in the artificial upwelling study were adopted (Liu and Jin, 1995): Discharge nozzle diameter = 1.2 meters; Effluent flow rate = 0.95 m3/s; Wave Height = 1.9 meters; Wave Period = 12 seconds. A typical tropical ambient temperature profile (Paddock and Ditmas, 1983) was applied. The effluent temperature was assumed to be 15oC. The salinity of both the ambient and the DOW effluent was 3.5%. The investigation was conducted by locating the injection nozzle at depths 0, 5, 10, 20, 30, 40 and 50 meters.
The equilibrium depth and initial dilution were calculated by using the interpolation method formulated by Paddock and Ditmas (1983). The effluent dilution was calculated by using Eq (4) without wave actions and by Eq (6) with wave actions. The results are shown in Figure 3.
The calculated results show that wave effects on jet mixing are insignificant when the injection nozzle is located at a depth below 30 meters from the ocean surface. Surface waves have smaller effects on the descending depth than on the initial dilu tion. Only density difference between the effluent plume and its ambient was considered in calculating descending depth. Residual momentum in the plume may push it further downward. A more detailed analysis will be shown in a forthcoming paper (Liu and Sou, 1999).
(a) Initial dilution
(b) Descending depth
Figure 8 Initial dilution and descending of a DOW
effluent plume
CONCLUDING REMARKS
Mathematical and hydraulic modeling analysis indicate that a wave-driven artificial upwelling device consisting of a buoy with a water chamber of 4.0 m in diameter and a tail pipe 300 m in length and 1.2 m in diameter with flowing controlling valves can produce an upwelling flow of up to 0.95 m3/sec in typical ocean waves off the Hawaiian Islands.
The effects of currents and waves on the dilution of DOW effluent discharged at the ocean surface are not accumulative. In strong currents and weak waves (ro / lQ <1.0), the wave effects on the dilution are negligible. On the other hand, in small crossflow and strong waves (ro/ lQ >1.0), the current effects on the dilution are negligible. A nutrient-rich deep ocean water (DOW) plume can be established and sustained in the open ocean by wave-driven artificial upwelling and effluent control.
Several important works are still pending: (1) field study of upwelling and mixing especially relative to the effluent diffuser design, with a model scale larger than the one used in 1996 and 1998; (2) experimental and field investigations to determine both pelagic and shallow benthic community response to the addition of DOW; (3) the development of a comprehensive ocean ecosystem model of upwelling mariculture; and (4) commercial application of DOW-enhanced open ocean mariculture.
ACKNOWLEDGMENTS
I am most grateful to my colleague and mentor, Dr Paul C. Yuen who brought me into this fascinating world of DOW and has offered me his expertise, support and encouragement. I am appreciative of the excellent research performed by my former students: Dr. Elliot Shiao-Hua Chen; Mr. John Jun Dai; Mr. Feng Guo; Mr. Hua-shan Lin; Dr. Douglas R. Neill; Ms. Jenny Jing Neill; Ms. In-Mei Sou. The completion of this study would be impossible without their efforts and contributions. I also like to express my sincere thanks to Ms. Carrie Matsuzaki for her excellent editorial assistance. This paper is based upon work supported in part by the US National Science Foundation (NSF) under awards BCS-9111878 and BES-9509562. Any opinions, findings and conclusions expressed in this publication are those of the author and do not necessarily reflect the views and policies of the US National Science Foundation
REFERENCES
Bretschneider, C.L. (1969). Wave forecasting, Handbook of ocean and under water engineering, McGraw-Hill Book Co., New York, Chapter 11.
Chen, H., Liu, C.C.K. and Guo, F. (1995). Hydraulic modeling of wave-driven artificial upwelling, J. Marine Env. Engrg., 1:263-277.
Chin, D.A. (1987). Influence of surface waves on outfall dilution, J. Hydr. Engrg. Div., ASCE, 113(8): 1006-1017.
Daniel, T.H. (1984). OTEC and cold water aquaculture research at the Natural Energy Laboratory of Hawaii, Proc. of PACON'84, MRM 2/47-52, Honolulu, Hawaii.
Faltinsen, O.M. and Michelsen, F.C. (1974). Motions of large structures in waves at zero Froude number, Proc. Int. Symp. on the Dynamics of Marine Vehicles and Structures in Waves, Univ. College, London, 91-106.
Fischer, H.B., List, E.J., Koh, R.C.Y., Imberger, J and Brooks, N.H. (1979). Mixing in inland and coastal waters, Academic Press, New York, N.Y.
Ger, A. M. (1979). ¡§ Wave effects on submerged buoyant JetsHydraulic Engineering in Water Resources Development and Management, IAHR, p.295-300.
Grove, R.S., Sonu, C.J. and Nakamura, M. (1989). Recent Japanese trends in fishing reef design and planning, J. Mar. Sci., 44:984-996.
Hwang, Robert R. and Yang, W. C. & Chiang, T. P.(1996). Effect of surface waves on a buoyant jet, J. Marine Env. Engrg. 3:63-84.
Liu, C.C.K. and Sun, L.C. (Eds.) 1990. Artificial upwelling and mixing, Proc. of the 1st Int. Workshop on Artificial Upwelling and Mixing in Coastal Waters. Center for Ocean Resources Technology, Univ. of Hawaii, Honolulu, Hawaii
Liu, C.C.K. and Jin, Q. (1995). Artificial upwelling in regular and random waves, J. Ocean Engrg.,22(4):337-350.
Liu, C.C.K. and Lin, H. (1998). Discharge and mixing of artificially upwelled deep ocean water, in: Environmental Hydraulics, Lee, Jayawardena, and Wang (eds), A.A. Balkema, Rotterdam, Netherlands, pp. 149-154.
Liu, C.C.K. (1999). Initial mixing of a buoyant jet under ocean currents and waves, Proceedings of 13th ASCE Engineering Mechanics Conference, The Johns Hopkins University, Baltimore, MD June 13-16, 1999.
Liu, C.C.K. Dai, J., Lin., H. and Guo,F.(1999). Hydrodynamic performance of wave-drive artificial upwelling, J. Engrg. Mech., ASCE, 125(7):728-732.
Liu, C.C.K. and Sou, I.M. (1999). Artificial Upwelling and Open Ocean Mariculture:
Formation of a Nutrient-rich Deep Ocean Water plume, Proc. of IOA (in preparation).
Nakashima, T. (1995). Answers in the upwelling, Look Japan, October 1995, pp.26-27.
Swan, C. and Kwan, S.H. (1998). Laboratory measurements of a jet discharged into waves, in: Environmental Hydraulics, Lee, Jayawardena, and Wang (eds), A.A. Balkema, Rotterdam, Netherlands, pp. 167-172.
Vershinskiy, N.V. Pshenichnyy, B.P. and SolovJ. Oceanology, 27(3),400-402.
Wright, S.J. (1977). Mean behavior of buoyant jets in a crossflow, J. Hydr. Div., ASCE, 103(5): 499-513.