Dossier Océan et énergie - Énergie Thermique des Mers
Sommaire IOA News Letters
What is the future for the OTEC/DOWA ?Assessing possible future OTEC markets
by
Michel A.
Gauthier
International OTEC/DOWA Association. IOA.
This article is extracted from the presentation « What Future for the OTEC/DOWA ?» made at the IOA ¡¦ 99.
INTRODUCTION
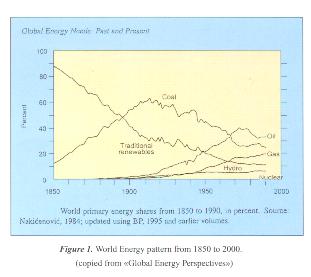
From 1850 to the beginning of the 19th century, coal supplied most of the world energy demand; then came oil and gas and, more recently, nuclear. In the developed countries energy is presently rather inexpensive and abundant but according to the most recent OECD scenarios and predictions for the next 50 years, world energy demand will jump from 9 Gtoe in 1990 to a minimum of 11 billion in 2020 and then possibly up to 14 or 25 Gtoe in 2050. This requires definition of a long term policy that includes
1) more
« sobriety» and better efficiency in the uses of energy;
2) greater
contribution from cleaner and renewable energy and/or from nuclear production.
Ocean Thermal Energy Conversion (OTEC) and more generally Deep Ocean Water Applications (DOWA) could significantly contribute to future world supply for renewables. This article is an approach to assess possible future markets for OTEC using the results of OECD scenarios.
1 ) What Is the future for the world energy supply ?
In 1950 the world energy consumption was 1.6 Gtoe with a population of 2.5 billion. In 1995 consumption had risen to 9 Gtoe with a population of 5.7 billion. The changes in world primary energy features from 1850 to 2000 are shown on Fig 1 (World primary features from 1850 to 2000).
Hundreds of books and reports have been written to describe the present characteristics of the world energy supply, its main issues and predictions for the coming decades. The information source for this article is the 1999 report «Energy : the Next Fifty Years» published by the Organization for Economic Co-operation and Development, (OECD). It includes results drawn from different scenarios studied by the International Energy Agency Institutes (IEA), the International Institute for Applied Systems Analysis (IIASA) and the World Energy Council (WEC).
The present main features of the global primary energy supply are :
a) The supply is based on burning fossil and nuclear fuels i.e. non-renewable resources. Ultimate Proved Recoverable Reserve (PRR) for oil and natural gas liquids is estimated to be 146 Gtoe with a present consumption of 3.3 Gtoe/year; PRR for coal is 994 Gtoe with a consumption of 4.6 Gtoe/year; PRR for uranium is 3 Mtu with a 1996 consumption of 0.036 Mtu/year.
b) The geographical distribution of the major resources : oil and gas, is different from that of the main consumers. The situation generates dependence and vulnerability of supply and is a source of severe conflicts.
c) The annual average energy consumption per capita varies by more than a factor of 100 between the richest and the poorest countries : the world average consumption is ~1.6 toe/year per capita with 4.5 toe/year for OECD countries and 0.05 toe/year for less advanced countries.
d) With carbon dioxide emission and storage of nuclear wastes the system presents severe threats to our natural environment.
e) This supply system is incompatible with sustainability.
The OECD study considered three different cases for predicting the changes in the supply system and examined three time periods starting from now to 2020, to 2050 and to 2100.
The first study cases involved (A) « Business-as-usual» scenarios implying a high growth for future development without significant changes in the world energy policies and international relations. One scenario (A1) assumes high future availability of oil & gas resources until the end of the 21st century. A second (A2) scenario assumes oil & gas resources to be scarce resulting in a massive return to coal. A third scenario (A3) assumes rapid changes in nuclear and renewable energies that result in phasing-out fossil, for economic reason rather than for resource scarcity.
The second case (B) scenario, assumes moderate economic growth, more modest in the developing countries than in other scenarios, and modest technology progress.
The third case (C) scenario, is the most challenging with a progressive change in energy policies and strong incentive to use energy with « sobriety» and more efficiently. It includes « green-taxes»,(e.g. carbon taxes), and changes in international co-operation and international agreements that are focused on environmental protection and international equity, with strong economic assistance and technology transfer.
The scenarios main features and results are summarized in Fig 2 (The three scenarios in 2050 and 2100 compared with 1990).

For the period from now to 2020 the general trends are :
a ) The demand will continue to be met mostly by fossil fuels because of the lack of economic viability of non-fossil sources (for wind and solar photovoltaic), or lack of public acceptance (for nuclear). Oil will remain the dominant fuel and gas will catch up slowly with coal. The share for nuclear power will remain static. Renewables will grow but their scale remains small. For most renewable energies, site specific issues and political considerations will dominate economic considerations.
b ) The geographical pattern of energy demand has shifted from the developed to the developing countries : from « North» to « South».
c ) « Business-as-usua»l trends will dominate. Unless new policies are put in place to curb energy uses and Green House gas emissions, the total world energy demand is projected to increase from 9 Gtoe in 1990 to a maximum of 15.4 in 2020 with net carbon dioxide emissions increase of 80 per cent. Together with China, the developing countries will account for almost 70 per cent of that increase.
For the longer term period from 2020 to 2100 the global results are :
a) The maximum total demand for primary energy may rise up to 25 Gtoe in 2050 and 45 Gtoe in 2100.
b) The energy market will continue to grow primarily in the developing world.
c) The increase in energy supply will be accompanied with a change in primary energy structure. After a slow increase the share of a mix of renewables or/and nuclear, from 22% in 1990 to 24 % in 2020, a stronger growth is predicted after that date. At least through 2020, the world will rely upon fossil fuels, with relatively few opportunities for alternatives. After 2020, despite a wide range of uncertainties on the level of energy demands across different scenarios, the results start to diverge and depend on political choices and development strategies chosen in the first decade of the next century.
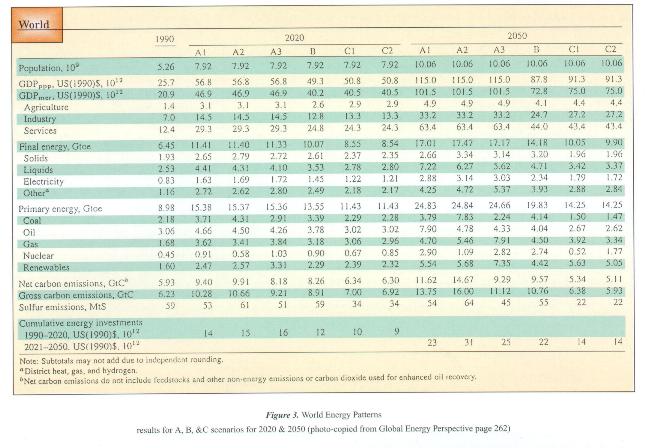
Detailed results are
shown Fig 3 (World Energy Pattern. Results of A, B, & C Scenarios for 1990,
2020 & 2050).
Among the three cases, only case C scenario is in full
compliance with the short term carbon dioxide Kyoto limits. Case C1 implies a
primary energy structure of 47% for oil and gas, 10% for coal and 43 % for
renewables and/or nuclear in 2050.
2 ) What is the future for OTEC/DOWA ?
The potential for renewables is large. The world demand of primary energy from renewables, as predicted for 2050 by models described previously, could, in theory, be satisfied with PhotoVoltaic. With an efficiency of 7W/m² it would require covering an area equivalent to 4 time France's area with PV cells. World demand from renewables could also be satisfied with Biomass : requesting the full development of the land biomass resource esimated to 6 to 7 Gtoe in the most favorable WEC prediction, or probably with Wind turbines. It could also be satisfied with OTEC, the resource capable of supporting a total installed capacity of about 12000 GWe (18.4 Gtoe).
Albeit the global potential of renewables is large, it has limits that we don't really know. Then we have to face the necessity of testing and developing several technologies to satisfy future energy demand. Also the priority for development of renewables is not the same for all countries. It varies with the state of development of the countries, their geographical locations, their specific natural resources, and the sensibility of their populations to environmental problems.
Answering the question « What is the future for OTEC ?»requests a detailed survey of the energy issues for each country or at least for groups of countries having common energy issues and profiles.
Such an approach is rendered possible thanks to predictive results from the OECD study made available by geographical regions as the North American region (Canada, Puerto Rico, Virgin Islands and USA), the Latin America and the Caribbean region, the Western Europe region, the South Asia region, etc.
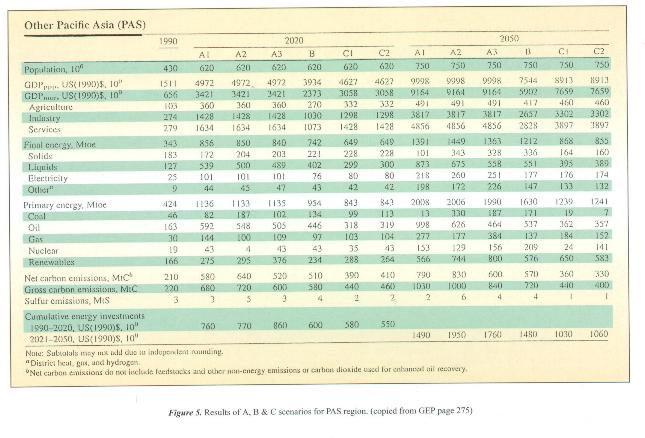
For the purpose of this article the PAS region was selected as one region of main interest for OTEC. The countries of the PAS region are listed in Fig 4 (List of countries in the « Other Pacific Asian»PAS group). Most of these countries have direct access to the OTEC resource. The region main economic, demographic and energy patterns, including present and future demands for renewables and nuclear, are indicated in Fig 5 (Results of A, B & C scenarios for PAS region). The minimum and maximum annual shares for renewables and nuclear for the PAS region are shown Fig 6.
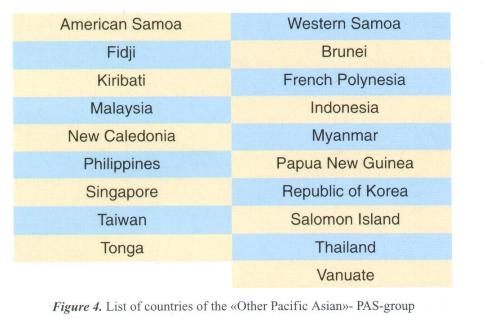 This region contains countries with
different level of interest with respect to OTEC. There is a group of small
isolated archipelagos including Fidji, Kiribati, New Caledonia, Tonga, Western
Samoa, French Polynesia, Salomon Island and Vanuatu, and a group of 5 big
countries including Korea,Taiwan, Indonesia, Philippines and
Malaysia.
This region contains countries with
different level of interest with respect to OTEC. There is a group of small
isolated archipelagos including Fidji, Kiribati, New Caledonia, Tonga, Western
Samoa, French Polynesia, Salomon Island and Vanuatu, and a group of 5 big
countries including Korea,Taiwan, Indonesia, Philippines and
Malaysia.
For the group of small archipelagos, the priority demand is for small OTEC electricity plants to supply coastal communities of a few thousands to a few tens of thousand inhabitants with electricity and other DOWA’s products. Their demand could be met with few hundreds plants of 1 to ten MW for a total capacity in the range of 500 MW to 1 GW, constructed with rugged prefabricated modular equipment.
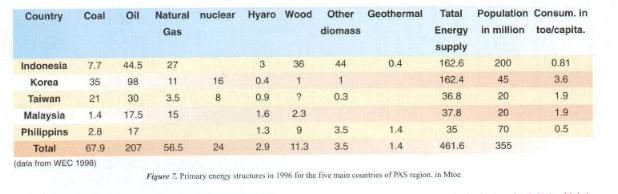
The five countries
of the other group represent today more than 80 % of the population and 90% of
the energy consumption of the whole PAS region. (See Fig 7 Primary energy
structures in 1996 for the five main countries of PAS region). These big
countries also have small isolated islanders and a demand for small OTEC/DOWA
but are more interested in the development of OTEC plants with several hundreds
of MW capacity which could contribute significantly to their need for
renewables. As an example, assume a share of 30 Mtoe for OTEC in 2020 (less than
10 % of the 376 Mtoe PAS maximum demand for renewables) and a share of 160 Mtoe
for 2050 (about 20% of the 2050 maximum demand), the total PAS capacity demand
for OTEC would be around 20 GW in 2020 and 100 GW in 2050, representings fleets
of one hundred and five hundred 200 MWe OTEC floating plants
respectively. A complete analysis
and usage of the results of the OECD scenarios studies for all the regions would
help to provide a better vision of the global possible markets for OTEC. This
analysis should include the future demand for the ultimate form of development
for OTEC : grazing plants to supply fuels as hydrogen, methanol, liquid ammoniac
or others to countries that are not located in the tropical region. As an
example, the minimum predicted demand for renewable energy for Western Europe in
2050 is estimated to 336 Mtoe. If 20 % of it had to be supplied with OTEC, it
would necessitate a fleet of five hundred units 200 MW OTEC fuel grazing
plants. The recent report
from OECD « Energy : the Next Fifty Years» shows that response to the
demographic and economic growth, maintaining our environment to a certain level
of quality and minimizing the risk of severe accidents and conflicts between
nations - in other words to allow a worldwide sustainable development of modern
societies - necessitates an increase in the global primary energy supply and a
more effective utilization of energy. It also requires cleaner and safer energy.
A rather wide panel
of renewable energy resources and technologies could contribute to future energy
demands. Strong public policies and important investments are needed to develop
cost effective tapping technologies and to control the environmental
consequences of their intensive usage. Sustainable
development concerns all countries and every country has to define its own
strategy to contribute to the development of the renewables best adapted to its
needs and local energy resources within its social and environmental context.
The pressure of public opinion will be decisive in the choices. OTEC/DOWA could be a
significant resource of renewable energy. In the short term the DOW resource can
serve the interest of small, more generally poor, isolated coastal communities
whose EEZs represent a major share of the world OTEC resource. In the longer
term, OTEC development could serve the interest of all nations including
industrialized ones located in the «North», far from the tropical zone.
These facts are favorable clues for establishing new deals in international
co-operation based on common interests and solidarity. Question may be asked
whether the DOW, which is essential to OTEC and also has a determinant role in
the equilibrium of our biosphere, should be considered a « common
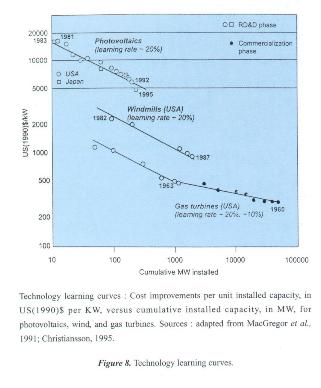
resource. OTEC costs are not
discussed in this article but implicitly it is assumed that the benefits of
OTEC/DOWA products could compete with that of other renewables. A better vision
of future demand for OTEC could contribute to a better estimate of the possible
decrease in cost one can expect from scale and learning effects. (See Fig 8
Technology learning curves). This article is an exercise that does
not pretend to indicate anything more than a method to assess possible «markets»
for OTEC. This exercise should be refined and completed to include all the
countries considered in the OECD report in order to give a global and long term
vision to industries and governments. During the IOA¡¦ 99 it has been proposed that this could be organized as
an IOA’s project
with IOA members welcome to participate. I thank the OECD
Service of Subsidiary Rights for authorizing the use of figures and data from
report «Energy. The Next Fivety Years» and also Jin Chung and Carrie Matsuzaki
from IOA Editors committee for their contribution in editing this article.
¡@ ¡@ ¡@ ¡@ Some
abbreviations used in this article : Some approximations used in
this article : 1 TkWh is
equivalent to 0.22 G toe 1000 cubic
meter of natural gas equal 36 GJ or 0,86 toe 1 t of coal is
equivalent to toe 1 ton of
Uranium equiv. to 10 000 toe. One GWe Wind
Facilities produces 1.5 GkWh per year equiv. ¡@ One GWe Hydro
Plant produces 3.8 GkWh/year equiv to 0.84 The
technically feasible OTEC unit power (the power than can be generated per
unit surface of the tropical ocean without significant environmental
effects) is estimated to about 0.2 Mwe/km-². 1) Rapport Boisson -
Energie 2000- Commissariat général du Plan . France Web page at site :
http://www.plan.gouv.fr/4 page energie 2010.htm 2) « WEC : 1998
Survey of Energy Resources ».18th edition. WEC Email info@wec.co.uk 3) « Rapport
mondial sur le developpement Humain» PNUD 1998. See the OECD document. OECD
biblio : ref 961002. 4) «Global Energy
Perspectives» » : N.Nakicenovic, A.Grubler and A.McDonald,
Editors (1998), Cambridge University Press. Summarised in OECD
report. 5) « EDF et les
Energies renouvelables ». Colloque Paris 18 Mai 1999. Syndicat des
Energies Renouvelable s. 6) Avery and Chu.
« Renewable Energy from the Ocean». Oxford University Press
1994. 7) Pierre Bonnaure.
(1999) « Une Politique Energétique pour la France» ». A
propos du Rapport 2010-2020 ». 8) « Energy.
The Next Fivety Years» ». OECD 1999.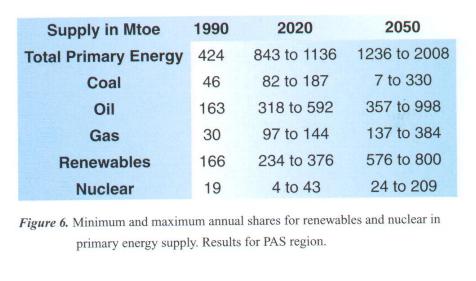
3 ) CONCLUSION :
Assessing OTEC possible « markets» »
ACKNOWLEDGEMENT
NOMENCLATURE.
DOWA
Deep Ocean Water Application
MJ 106 joule
OTEC
Ocean Thermal Energy Conversion
GJ 109 joule
toe
ton oil equivalent
TJ 1012 joule
Mtoe
Millionton oil equivalent
PJ 1015 joule
Gote
Gigaton oil equivalent
EJ 1018
joule
to 0.33
Mtoe.
Mtoe.
One GW
OTEC (or Nuclear) electricity plant produces 7 GkWh
per year or
1.54 M toe.
One GWe
OTEC plant could tap the OTEC energy potential from an ocean surface area
of approximately 5000km².
The ocean regions most suitable for OTEC
operation have an area of 60 Mkm² and the OTEC resource could support
12000 GWe installed capacity.
One GW liquid ammonia OTEC plant can
produce 0.6 Mtoe/year of fuel . [Avery]REFERENCES
La
documentation francaise ,1998/533p.